OpenOrienteering is a project developing a collection of tools which help with the creation of orienteering maps and the organization of orienteering events.
Posted on 21 January 2012 by Thomas Schöps
Recently, I’ve made some good progress on the symbol types, so it’s again time to present the newest features here. The current status is that all planned symbol types except lines are now more or less finished, this means points, areas, texts and ‘combined’ symbols. It does not mean that it is possible to draw objects with these symbol types on the map yet - the drawing tools will be another big piece of work - but it is now possible to define the various symbols having these symbol types, so it is almost possible to start building the IS(S)OM symbol sets.
Because a picture says more than a thousand words, here is a screenshot of the area symbol editor:
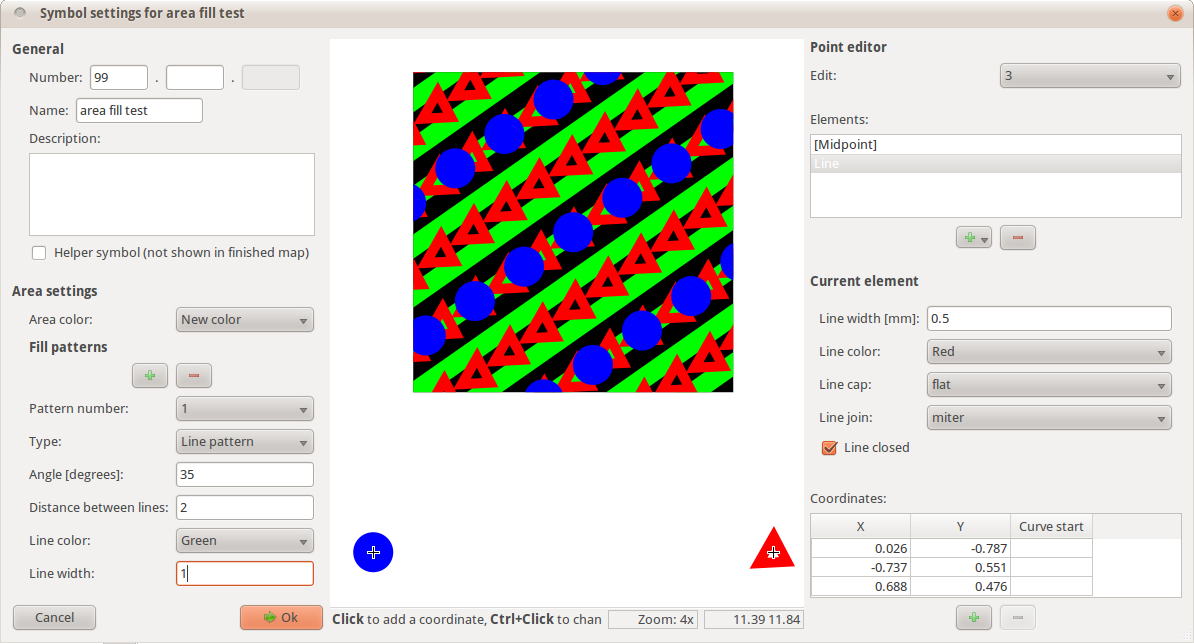
It shows a test symbol with black background and various fill patterns consisting of line symbols and rows of point symbols. The upper left part of the window contains the general symbol settings, in the lower left part the area settings can be adjusted. The preview in the middle shows the area symbol at the top and all point symbols which appear in its fill patterns at the bottom. These point symbols can be edited with the point symbol editor on the right.
Next is the text symbol settings window:
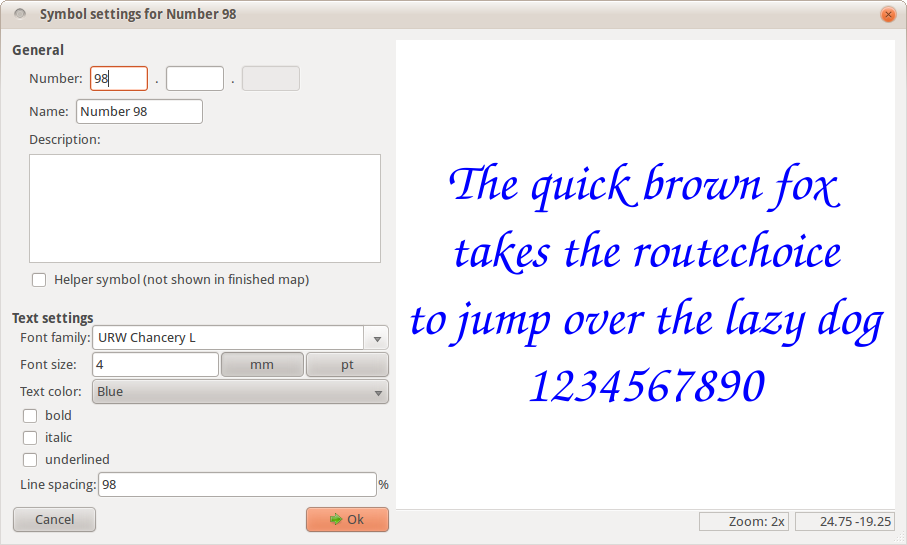
I couldn’t resist ;-) Apart from that, the settings contain the standard font settings one would expect.
The last ones are the combined symbols:
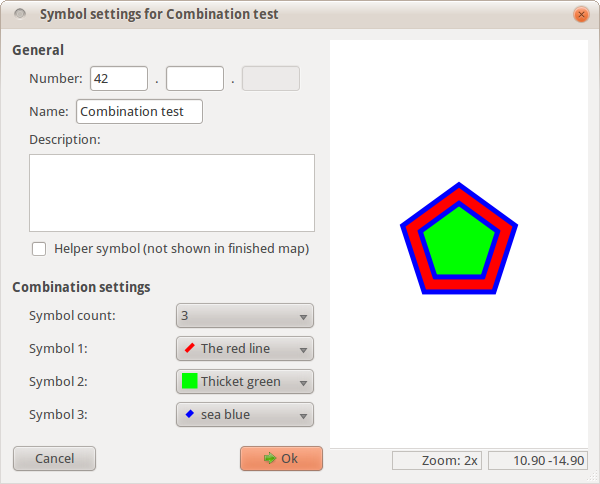
This symbol type allows to combine two or more line or area symbols into a new one. For example, with this a building outline and a building area filling could be combined into a single ‘building’ symbol which makes it more convenient to use.
And finally, there is now also a symbol browser where the defined symbols can be selected:
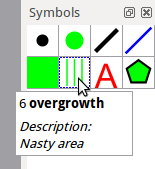
The tooltip shows the symbol number, its name in bold and after F1 has been pressed the symbol description is blended in at the bottom. In contrast to OCAD, the symbol icons used here are not separate raster images, instead they are generated directly from the symbol properties which makes them scalable and removes some effort from defining symbols. If it should turn out that this leads to too indistinguishable icons, some settings for them could be introduced.
That’s it for now. My plan for the next developments looks like this: first, I want to finish the line symbols and some basic drawing tools, so objects can be placed on the map. Then, I want to create a first preview build of the program for Windows which makes it easier for you to try it out and give feedback. Let’s see how long this will take. Bezier curves in combination with dashed lines having dashed border lines whose dashes need to be synchronized on both sides could be really painful ;-)
Posted on 10 January 2012 by Thomas Schöps
As usual, here comes a small update about development on the Mapper program. A feature which I finished recently is the point symbol editor. It should already be usable to define all point symbols in the ISOM/ISSOM standards.

The screenshot shows a demo symbol containing one line element (black), one area element (orange) and some point elements. On the left side, there are some general settings which are the same for every symbol type. In the lower left part, there are the symbol type specific settings. For point symbols, this is currently only one: whether the symbol should be rotatable or always oriented to north. In the middle of the window, there is a preview of the symbol. The bar at the bottom allows to load a template and to center it on the coordinate system origin, either using its bounding box or using its center of gravity - something that could be useful to draw some of the orienteering point symbols. On the right side is the point symbol editor. Here, the elements the point symbol consists of can be defined. The element coordinates can either be entered at the bottom or set by clicking at the preview in the middle. For lines and areas, there is also the possibility to use bezier curves (not shown here).
That’s it already for this time. My plan is now to continue with the symbol browser and the other symbol types, after that the drawing tools can be implemented and the program will hopefully slowly start to become usable for map drawing.
Posted on 07 January 2012 by Thomas Schöps
Here comes another small update about some of Mapper’s current features. The first one for today is color definition for map objects:
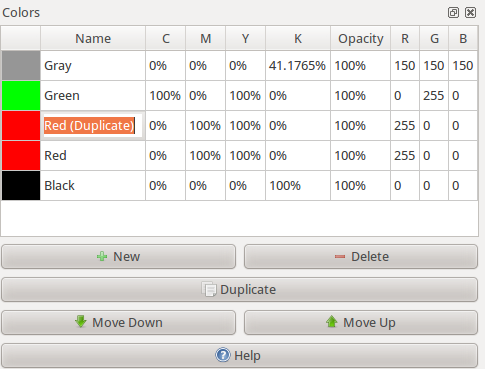
Yes, that’s not too exciting, but necessary. Editing in this table works inline like in a spreadsheet program, colors can be defined by specifying CMYK or RGB values. Colors higher in the list will be drawn on top of the lower colors.
One thing that probably would be useful is some sort of color management which could be used to make the on-screen colors appear exactly as they are printed later. But I have no experience with this, neither in implementing it nor in even just using it, so I don’t know how hard that would be. Maybe I will look into it later, but for now it is more important that map drawing works at all.
The second feature for today is drawing on templates:
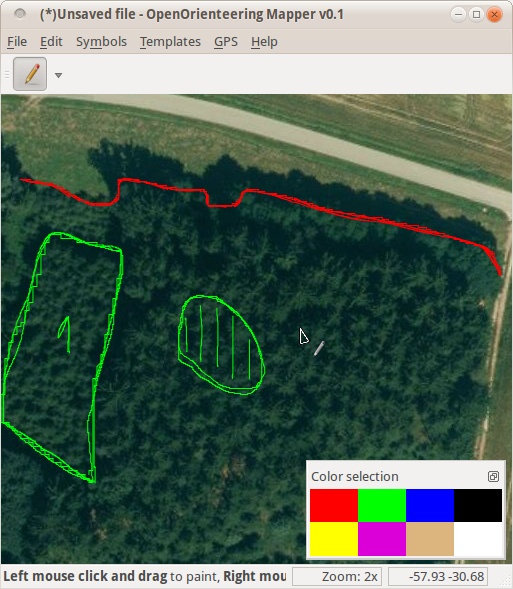
It allows to paint directly on raster images loaded as templates, so in mobile use the program can be used like a drawing board. Of course it will also be possible to draw map objects directly, but sketching like this has some potential benefits:
While having more objects on the map will degrade performance, this does not happen when sketching on a template. This could be important for the use on mobile devices.
Erasing drawn lines or parts of them is intuitively possible by painting over them in white, the “eraser color”. Map objects would first have to be selected, cut into pieces, and then the correct piece deleted.
The setup for the sketching is still a bit more cumbersome than necessary though. At the moment, if you do not want to destroy your base map images when painting and want to be able to erase what you have drawn, you have to create a separate transparent image template, load that on top of the base maps and use it for drawing. For the future, an idea is to offer a separate “Sketch” template type which would be a sketching canvas that grows automatically to cover the area which is painted on.
Currently, I am working to implement the first map symbol type, point symbols, and an editor to define such symbols. This is a lot of work and it seems that for every item on my “to do”-list that is accomplished, two new items come to mind. At least it is already possible to create the simplest of the point objects. More about it will come with the next update.
Posted on 04 January 2012 by Thomas Schöps
From now on, I will push code changes to a public git repository so everyone can have a look at the code. You can download it like this:
git clone git://git.code.sf.net/p/oorienteering/code oo-mapper
Some more or less technical details: The program is written in C++ using QT. While developing, I only test on Ubuntu linux, so the code probably won’t even compile with Visual C++ on Windows without some changes. The license is GNU GPL v3. At the moment, the code is only interesting for programmers, as it is not possible to do anything useful with the program yet. Ok, actually it could be abused as a simple painting program or gpx viewer, but that is not really its purpose.
You might be wondering how C++ with QT is supposed to work on Android. If so, check out the “Necessitas” project. It is still in alpha stage, but I hope that it will work well enough.
Posted on 04 January 2012 by Thomas Schöps
Among the few planned features of OpenOrienteering Mapper which are already working are templates and georeferencing of them. Two types of templates are implemented: image templates which are normally used to display base maps and, since yesterday, also GPS templates.
The supported formats for image templates are those supported by QT: bmp, gif (read-only), jpg, png, tiff and a few obscure ones. If someone needs support for another format, it would be very easy to extend this, for example using FreeImage. For GPS tracks, currently only gpx is supported. At first I looked for a C++ library which supports the loading of GPS track files in various formats, but did not find anything which seemed really suitable. The closest was using GPSBabel as a library, but it seems like it is not intended to be used like this. So, for now I implemented a simple gpx loader myself. To convert the coordinates from the gpx file, consisting of latitude and longitude on the earth ellipsoid model, to map coordinates, an orthographic projection is used. The center of the first loaded track is automatically suggested as the origin for the projection, but this can be adjusted.
All types of templates can be georeferenced. This means adjusting their transformation so multiple templates, or a template and the map, fit together. It is done by specifying two or more corresponding points (“pass points”) on the template which should be moved and the reference it should be adjusted to, then a transformation for one template can be calculated which makes these points match as good as possible. The program currently uses only scaling, rotation and translation (no shearing) as transformations to do this and no deforming of templates is done.
Following is a screenshot showing an image and a gps template. The image is the green background containing the red line, which was generated from a gps track using an external program, the gps template is the thin purple line showing the same track loaded directly. The picture was taken after I implemented the gps templates, so I wanted to compare the two images of the track to see if the implementation works correctly and they are identical. To be able to do that better, I added four pass points to the directly loaded track which are shown as connected red and green crosses. This is the state before applying the georeferencing:
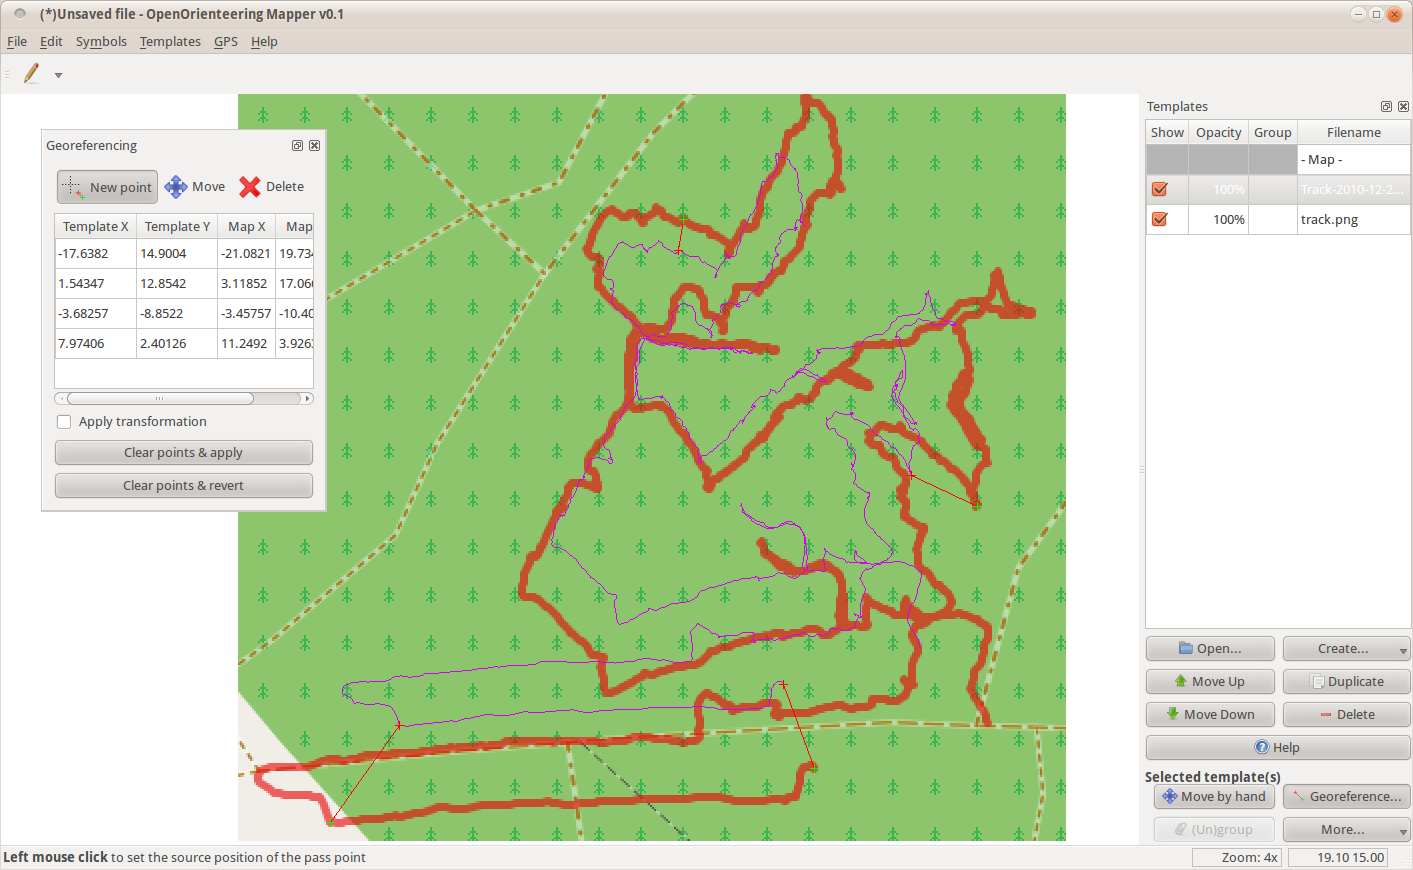
After clicking on “Apply georeferencing”, it looked like this:
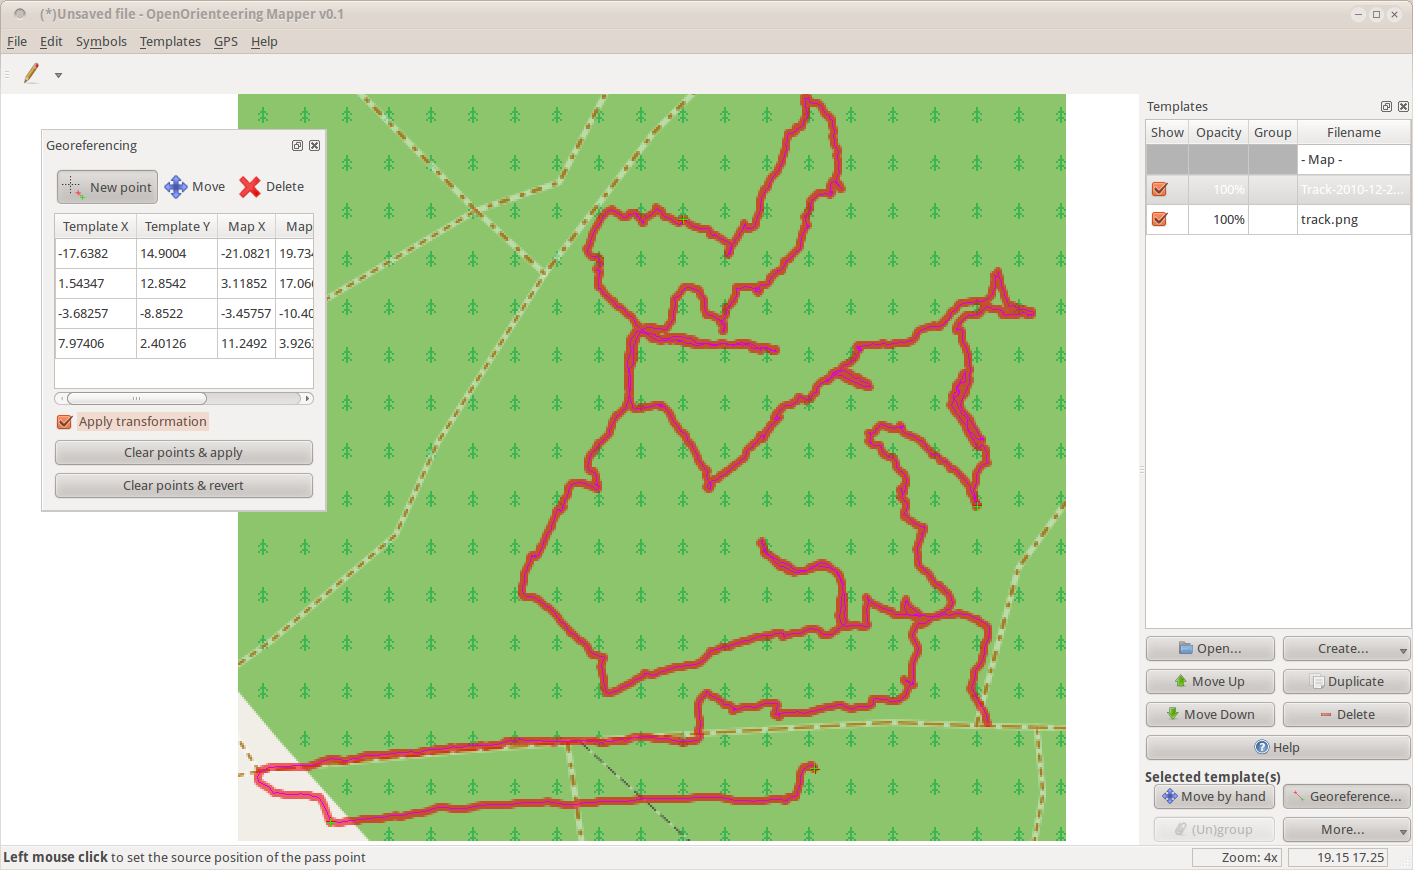
Seems to fit perfectly :-) The red and green pass point crosses are now almost on top of each other, showing that the pass points are consistent. The error in meters could be read from the georeferencing box on the left. If something went wrong, it is always possible to undo the transformation by unchecking “Apply georeferencing”, moving the pass points, deleting some or adding more, and trying again. The points can even be edited while the transformation is active.
Note that while in the screenshot only a track is shown, displaying waypoints and their associated names from gpx files is also supported. And if another gpx file is loaded, it will automatically be transformed to match with the first loaded track.
A possible addition to the templates for the future would be the ability to load digital elevation models directly, without having to use an external program to visualize them first.